Valorum PlantExplorer User Guide
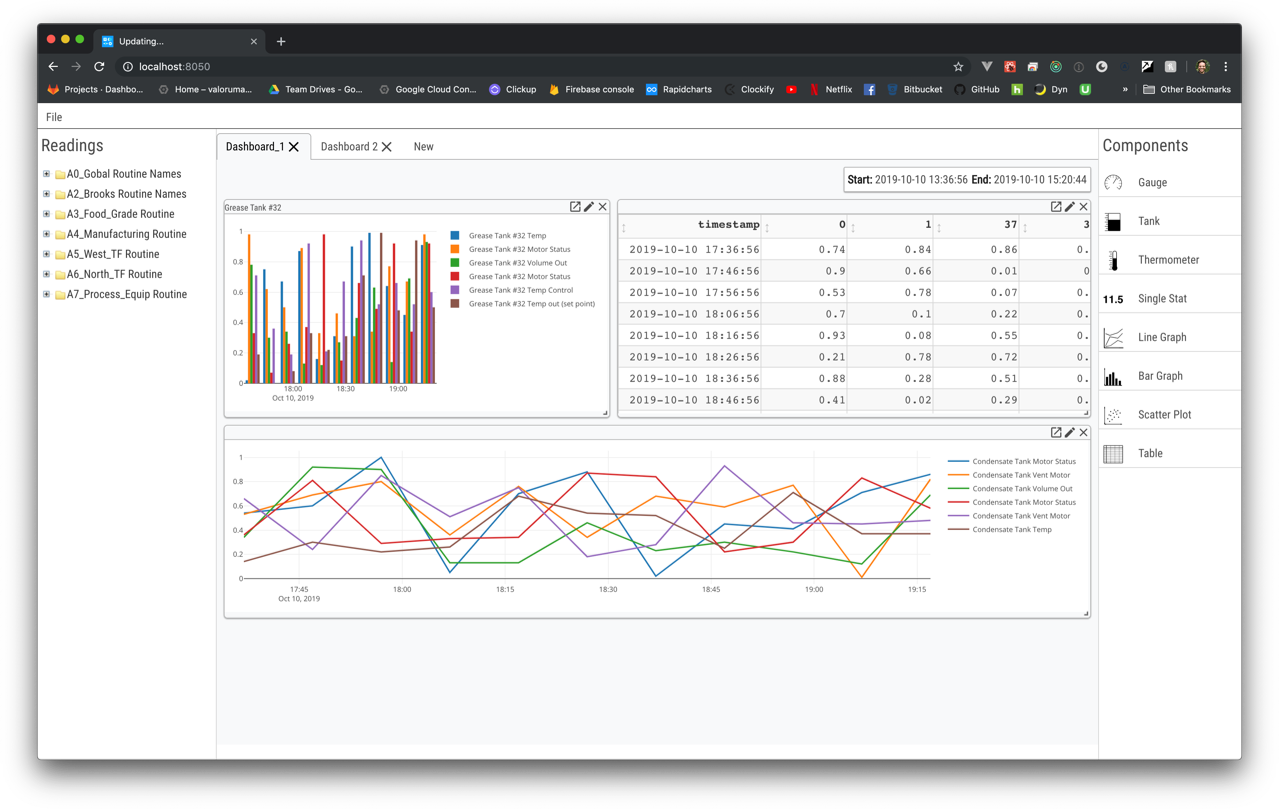
Figure 1: The PlantExplorer interface
Introduction
This is the user guide for Valorum’s PlantExplorer data visualization and reporting tool.
The PlantExplorer interface has 4 main components:
Readings – the readings extracted from the machinery
Panels – a display or table containing
Dashboard – an arrangement of Panels containing readings
Time Window – controls for the start and end time for all reading data – one per Dashboard
This document will describe each of these components, the operations that can be done with them, and how they relate to one another
Readings
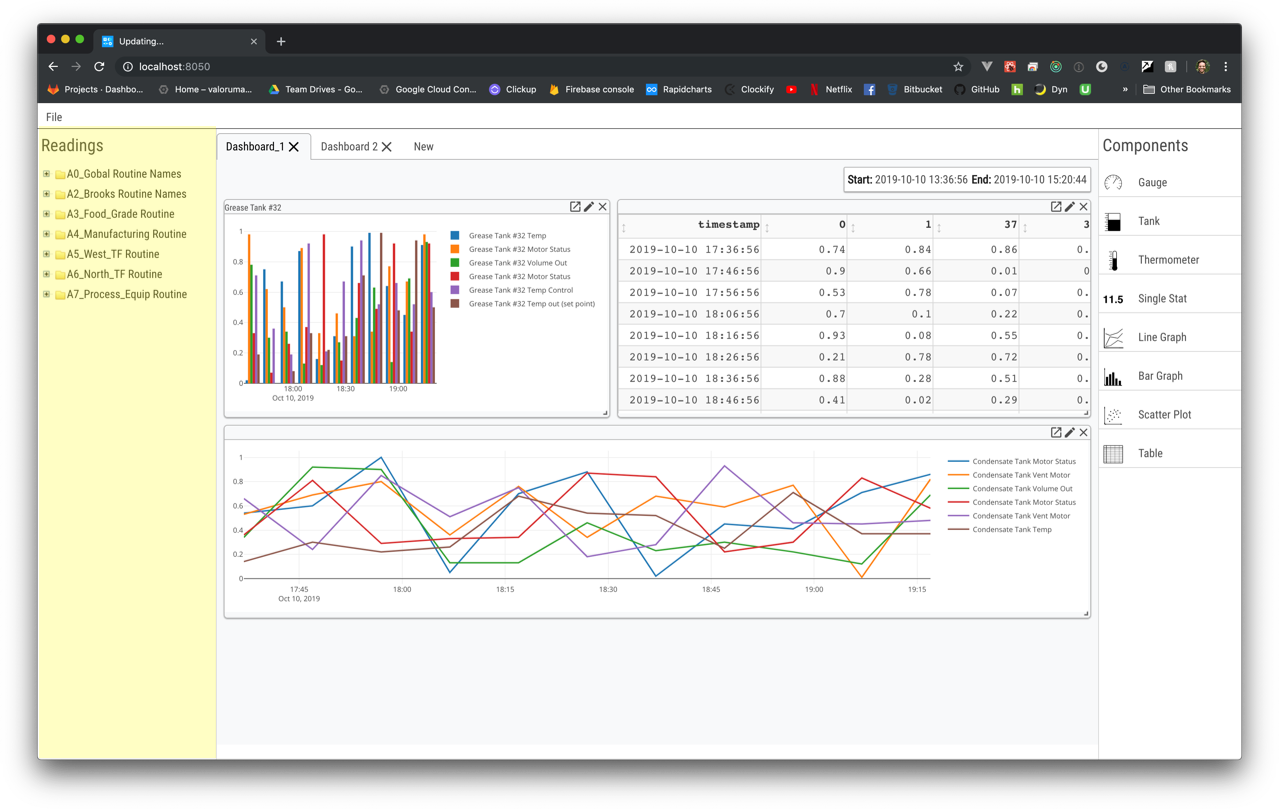
Figure 2: The PlantExplorer reading list contains a tree-like structure of machine groups, machines, and Readings for a machine
The readings section is on the left-hand side of the PlantExplorer interface as shown in Figure 2:
The readings are organized in a 3-level hierarchy:
Machine group
Machine
Machine reading (variable) list
This hierarchy is displayed in a tree structure in the Readings area
A folder icon appears to the left of each machine group or machine name
You can expand the machine group or machine level readings by clicking on the + indicator to the left of the folder icon
When a machine group or machine is expanded, all its children will appear beneath it, slightly indented
Also the + icon will be replaced by a - icon
Clicking on the - icon will cause the expanded machine group or reading list to be collapsed
The reading to machine and machine to machine group structure is fixed and cannot be changed within the PlantExplorer interface
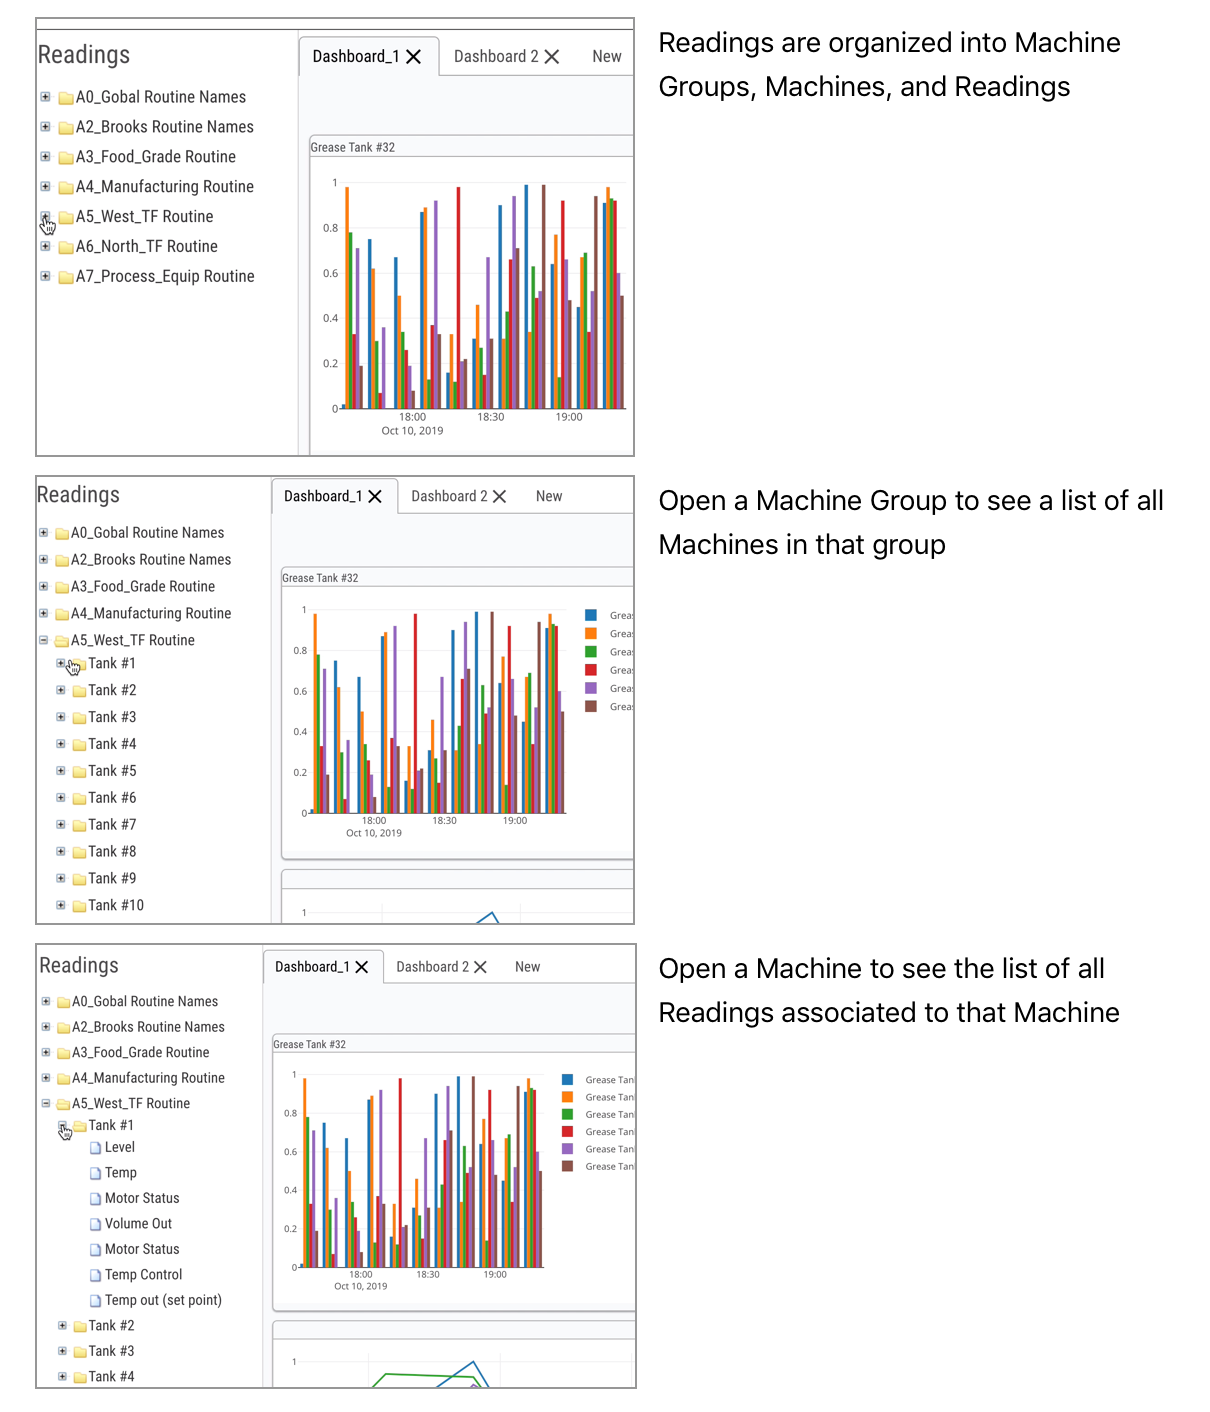
Figure 3: Navigating the PlantExplorer Reading list
Panels
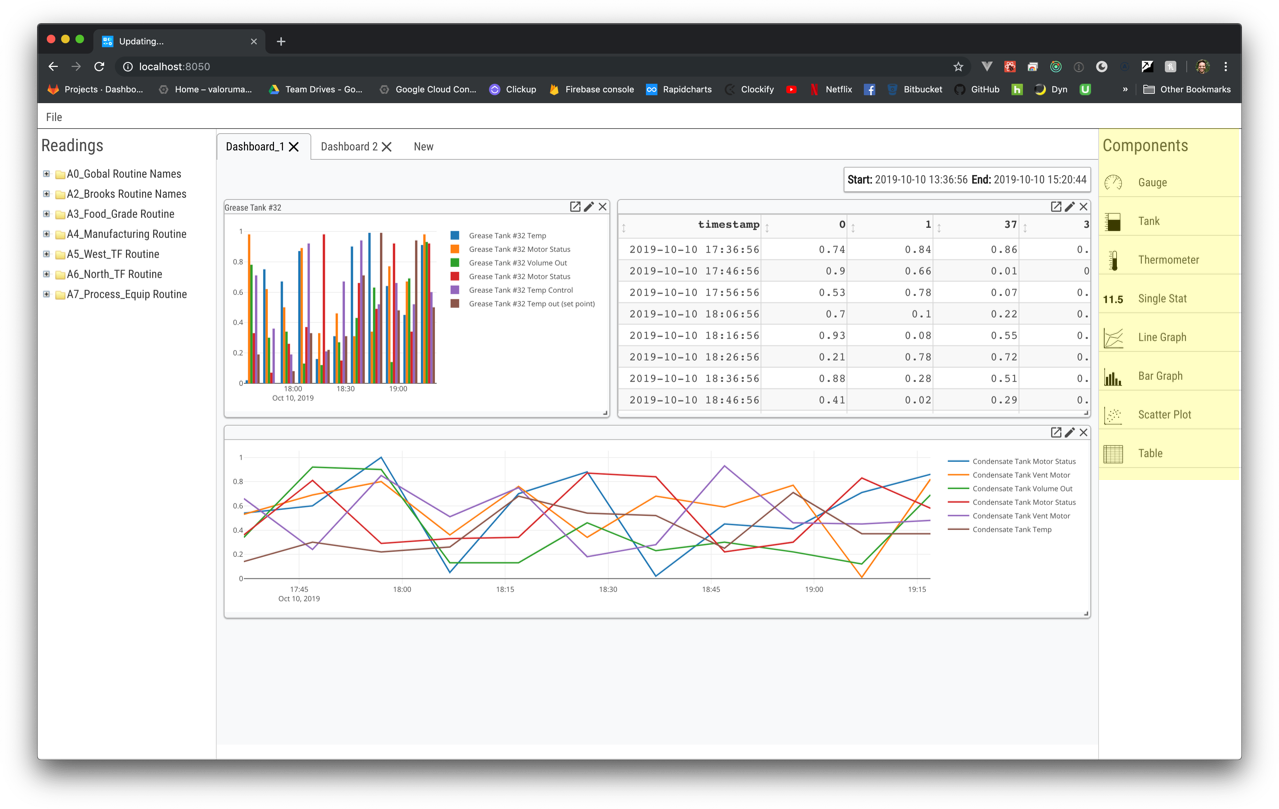
Figure 4: The PlantExplorer Panel list contains a number of visual and tabular Panels used to display data
PlantExplorer Panels are the core components you will use to visualize and understand your data
The Panel list is located on the right-hand side of the PlantExplorer interface as shown above
Adding a Panel
To add a new Panel to the Dashboard, hover over the Panel type you would like to add
Then click-and-hold on the Panel type and drag it into the main Dashboard area
After releasing the mouse the Panel will be added to the Dashboard
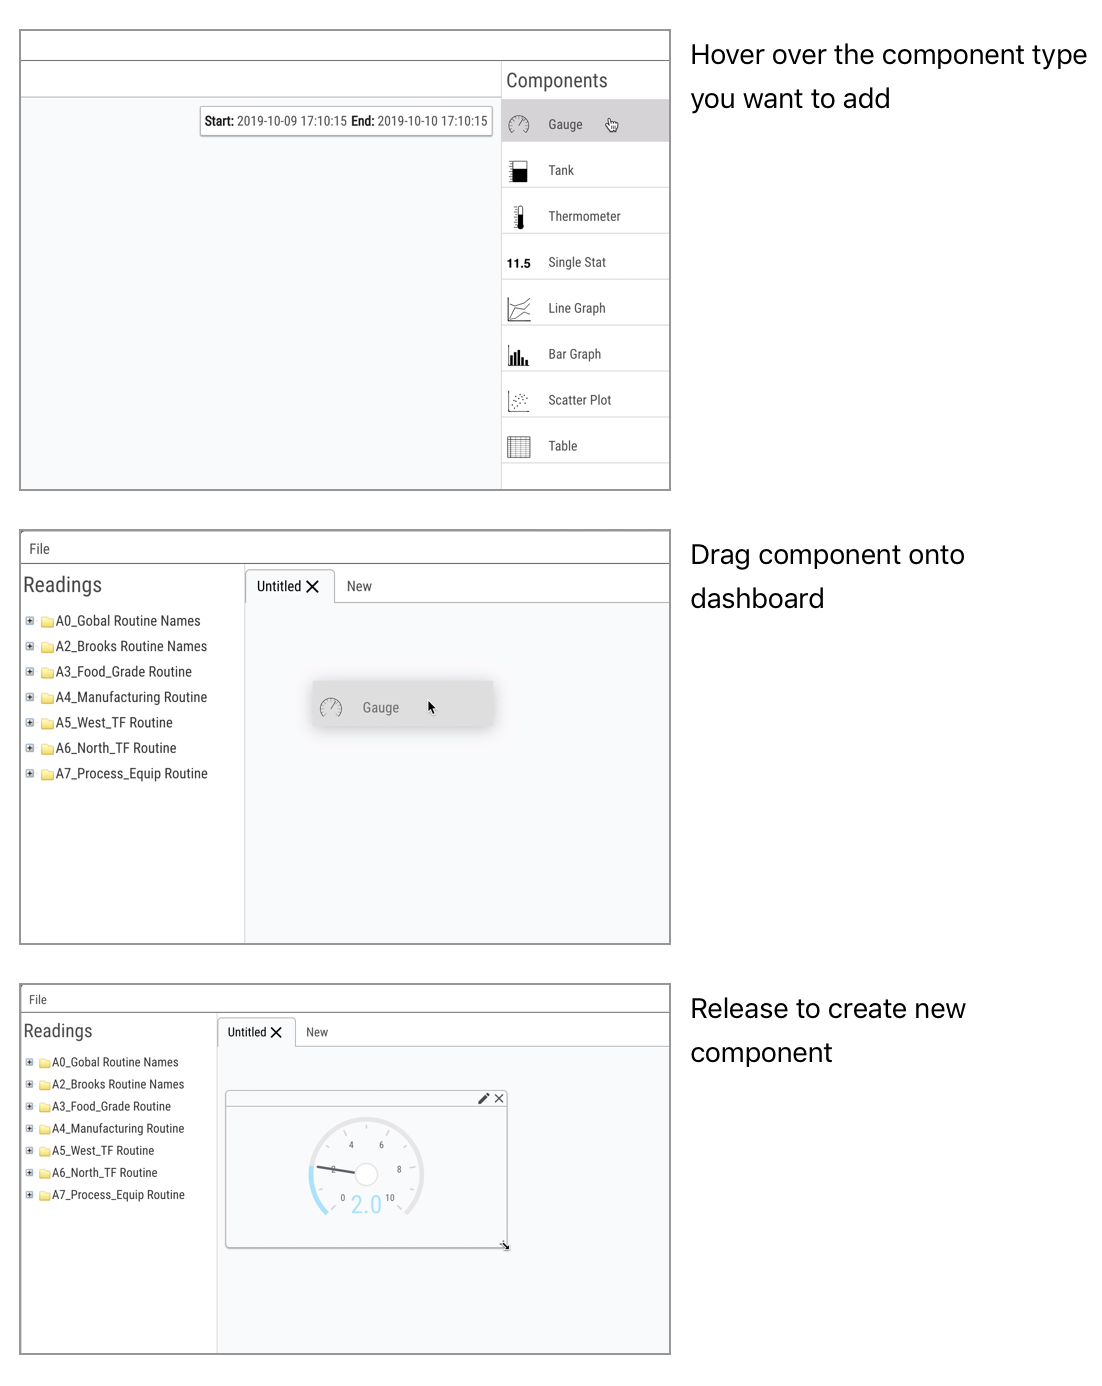
Figure 5: Adding a new Panel to a PlantExplorer Dashboard
Resizing Panels
Panels can be resized or moved around on the Dashboard
In order to resize a Panel move the mouse to the bottom-right corner of the Panel
You will see the mouse icon change to an arrow pointing down and to the right
Then, click-and-hold the mouse and move the bottom-right corner to a new location
The top-left corner will remain fixed and the Panel box will resize to fill the space between the top-left corner and the new bottom-right corner position at the mouse
Release the mouse and the Panel will remain sized according to the mouse’s last position while the click was held
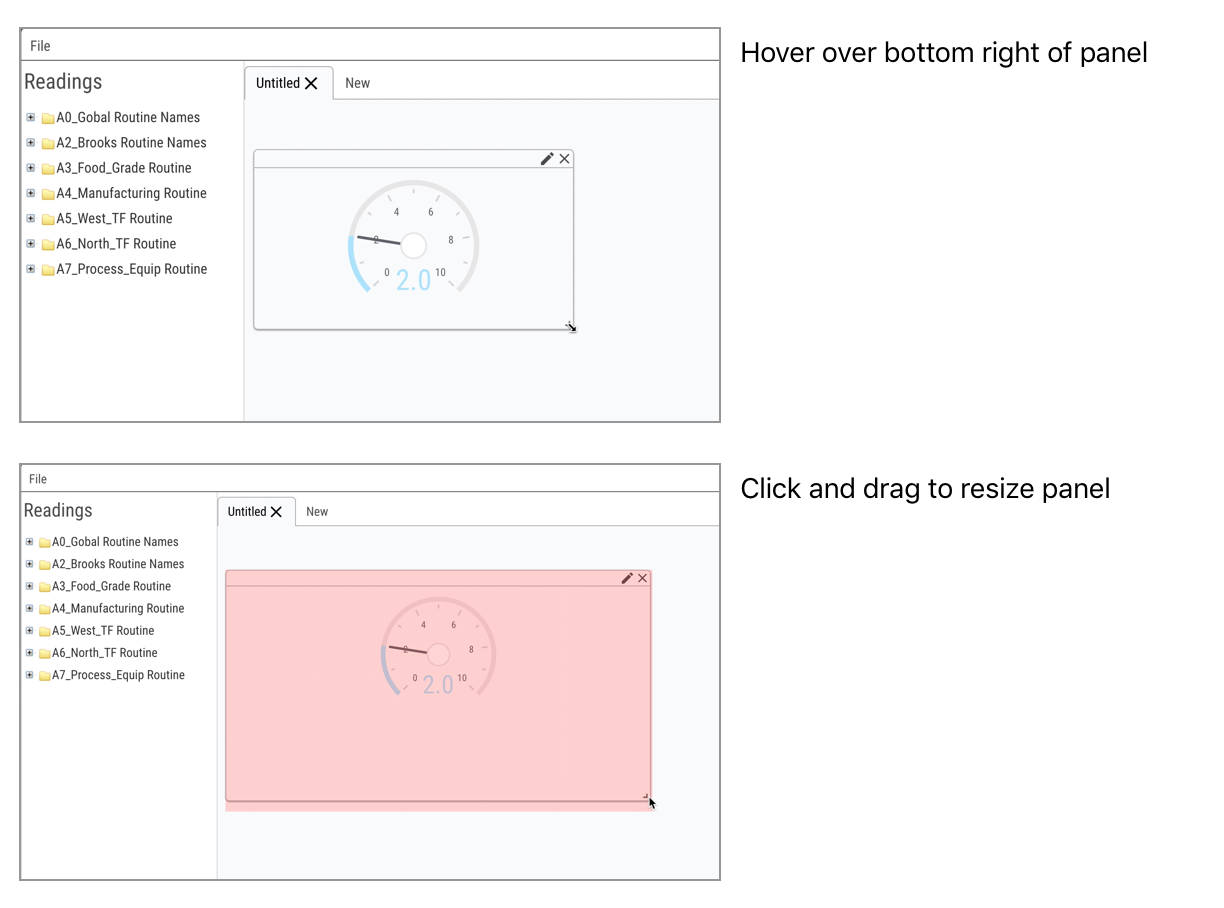
Figure 6: Resizing a Panel in PlantExplorer
Moving Panels
Panels can also be moved
To move a Panel; hover the mouse over the top bar of the Panel, click-and-hold, then drag the Panel to a new location
When the mouse button is released, the Panel will remain fixed at the indicated position
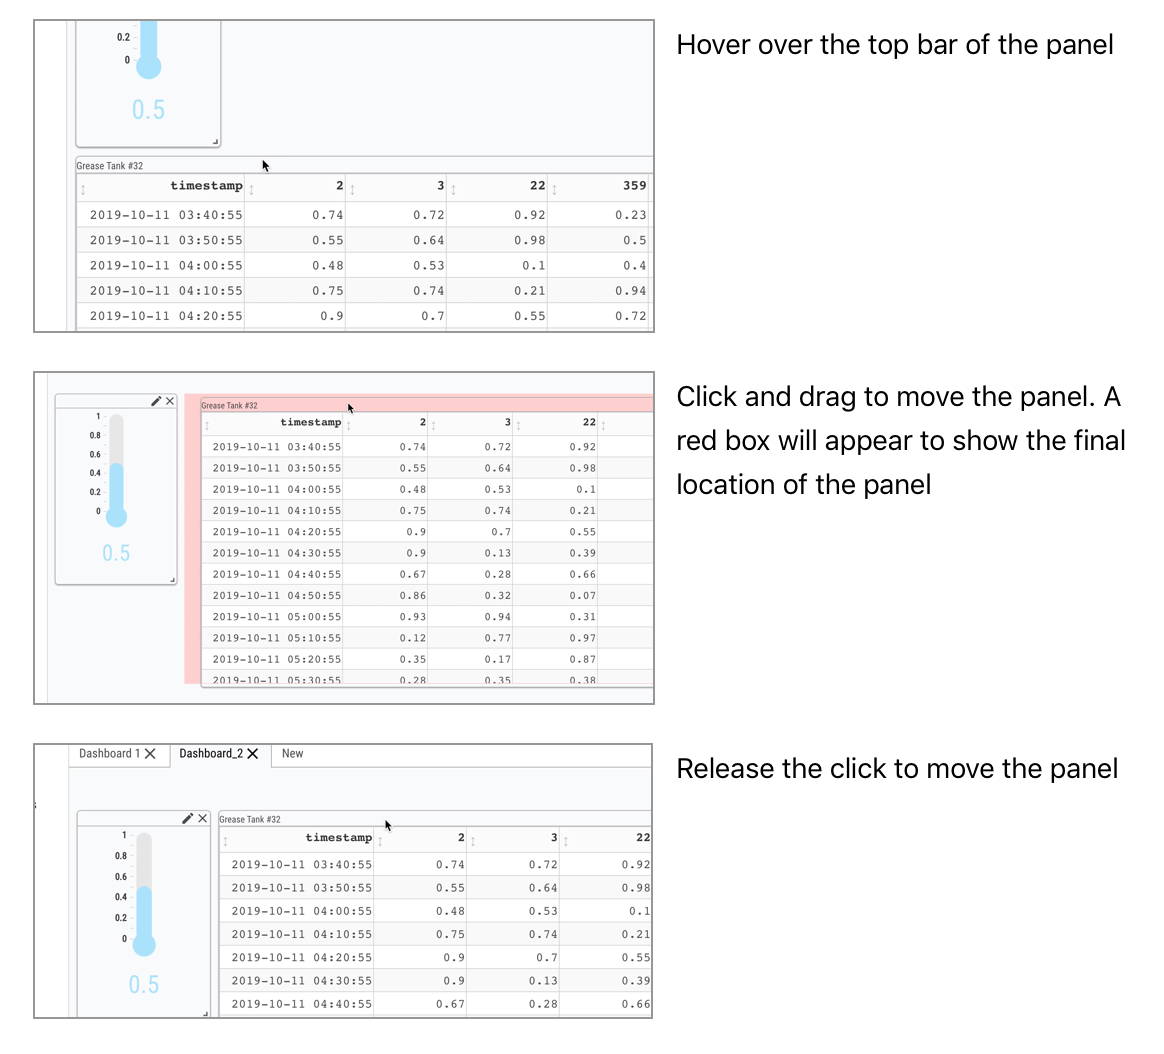
Figure 7: Moving a Panel in PlantExplorer
Deleting Panels
Panels can be deleted by clicking on the X icon in the top right corner of the Panel
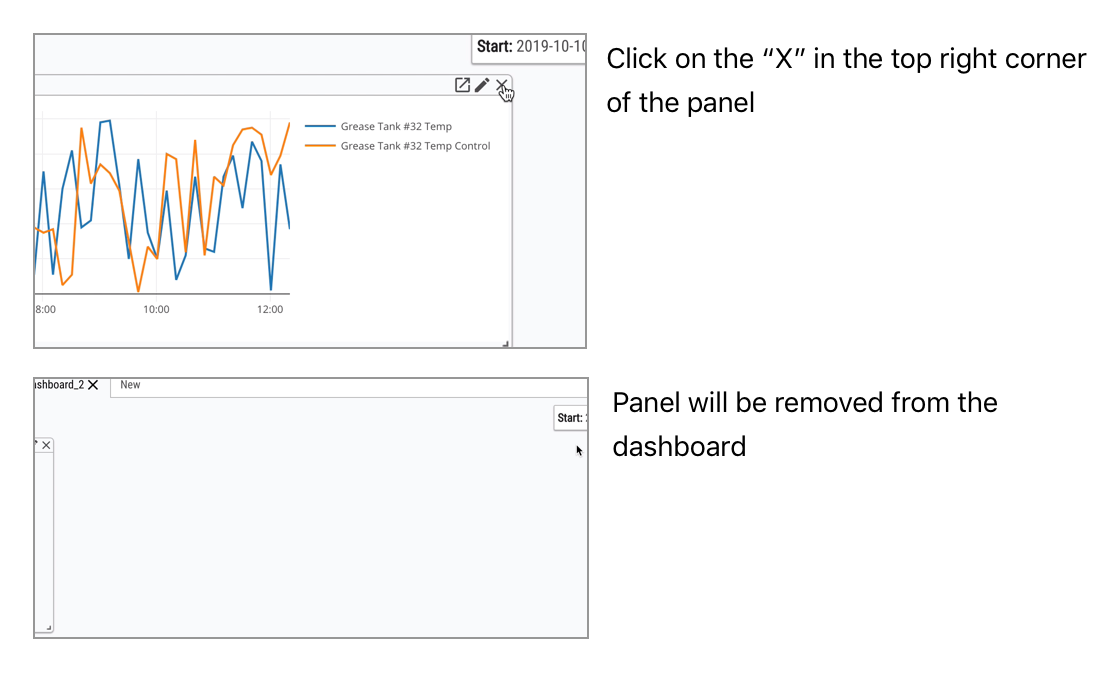
Figure 8: Deleting a Panel in PlantExplorer
Add a Reading to a Panel
With the Panels set added to the Dashboard, it is time to add data to them
To add a single reading to a Panel, navigate through the reading list to find the reading you would like to add
Then click-and-hold the reading name and drag it to the Panel
When the mouse click is released, the data for the reading will be added to the Panel
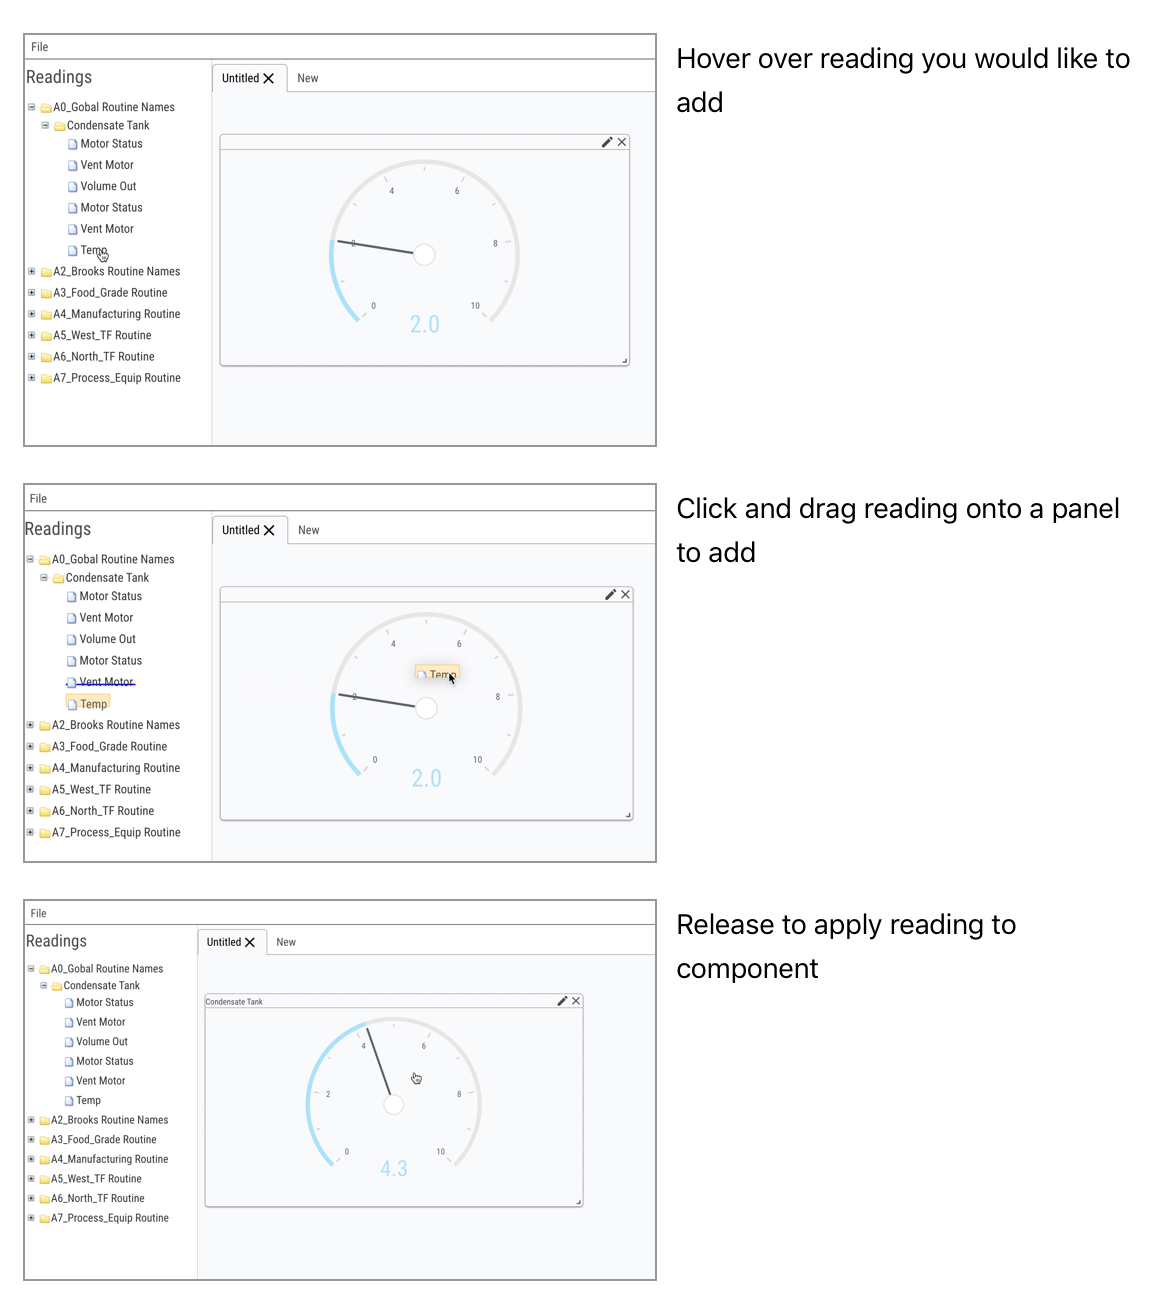
Figure 9: Adding a Reading to a Panel
Add a Group of Readings to a Panel
You can also add a group of multiple readings to a Panel at the same time
To do this, hover over a machine group or machine name in the Reading list
Then, click-and-hold the machine group or machine name, drag the item to a Panel, and release
Upon release, all readings in that group will be added to the Panel
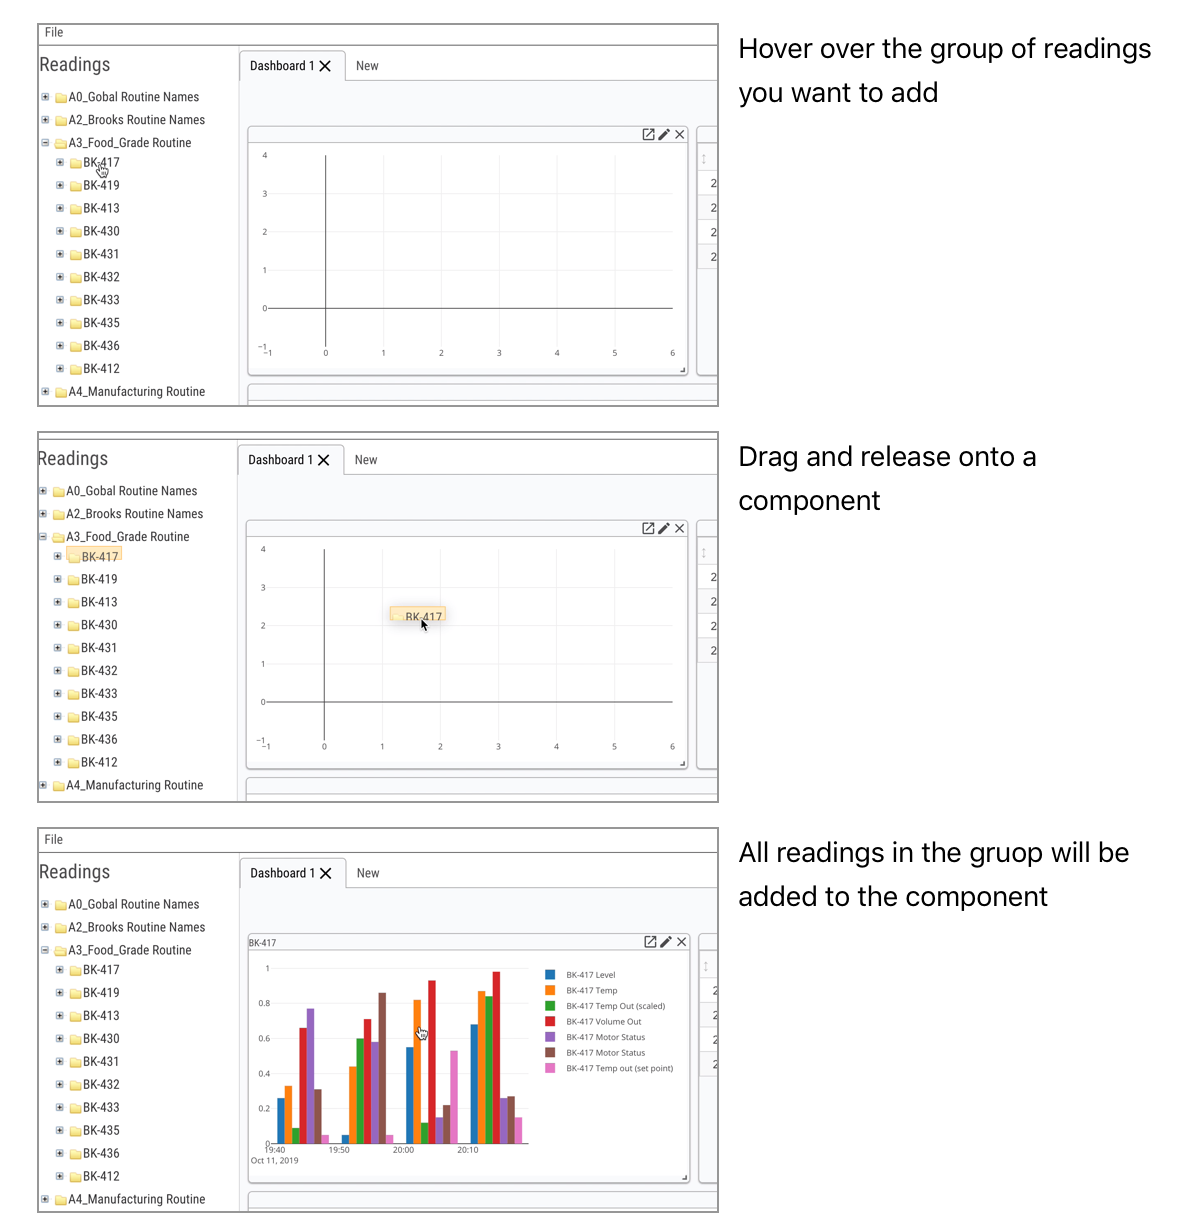
Figure 10: Adding a Group of Readings to a Panel
Edit Panels
Each Panel has a number of settings that can be configured
These settings differ by Panel type and apply to a single instance of that Panel type, not to all Panels of the type
To configure these settings bring the mouse to the pencil icon at the top right corner of a Panel
When the pencil is clicked a modal sub-window will be opened with the settings for that Panel
Inside that window you can adjust settings
When you are finished, click the Save button to save your changes or the Cancel button to discard them
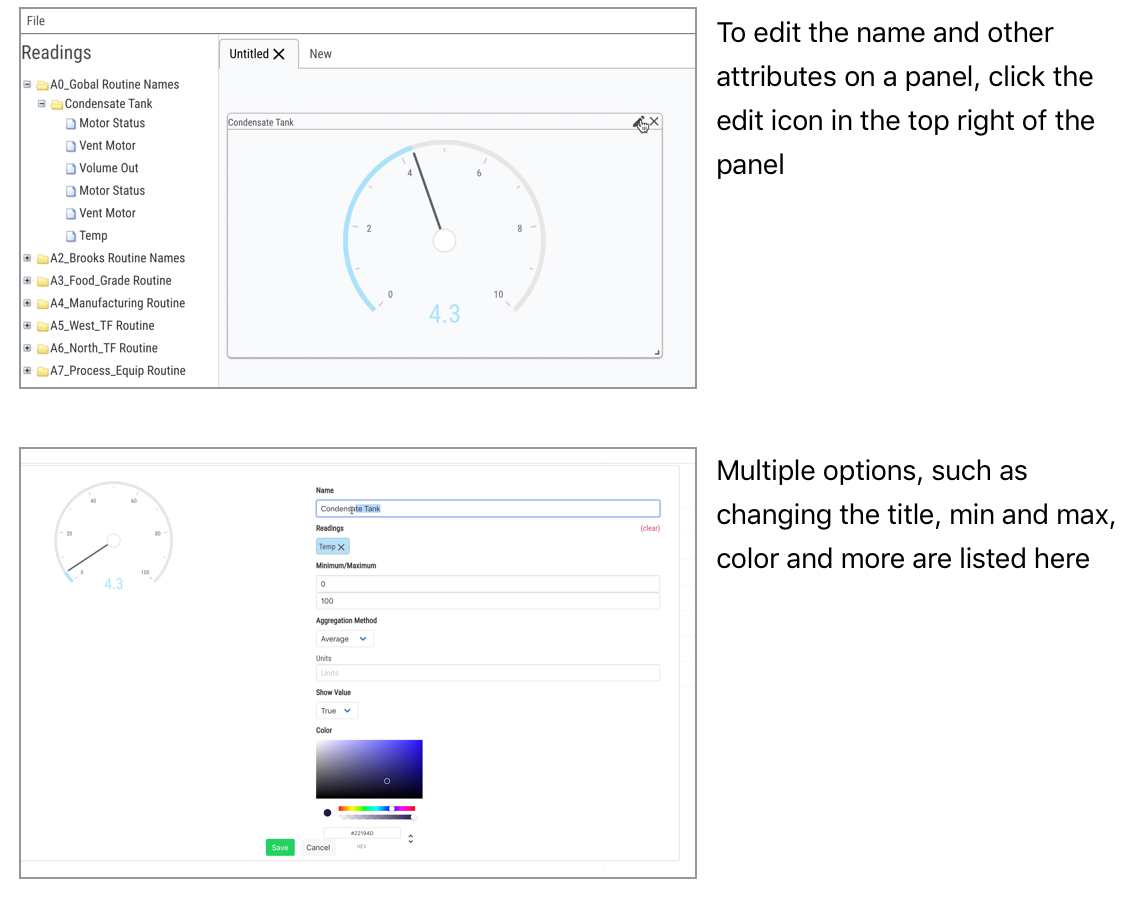
Figure 11: Editing the settings for a Panel
Remove Reading from Panel
All Panels that support multiple readings (e.g. charts, tables) have a Readings section in the settings area
Each reading currently associated with the Panel will be listed
Clicking on the X symbol next to the reading name will remove that reading from the Panel

Figure 12: Editing the list of Readings attached to a Panel
Exporting Panel Data
All data within a Panel can be exported by clicking the share icon (square with an arrow leaving the top-right corner) in the top right corner of the Panel
When that button is clicked, all the data currently attached to the Panel will be exported to a comma-separated-values (CSV) file
You can then use the CSV file in another program (e.g. Microsoft Excel) to do further analysis of the data
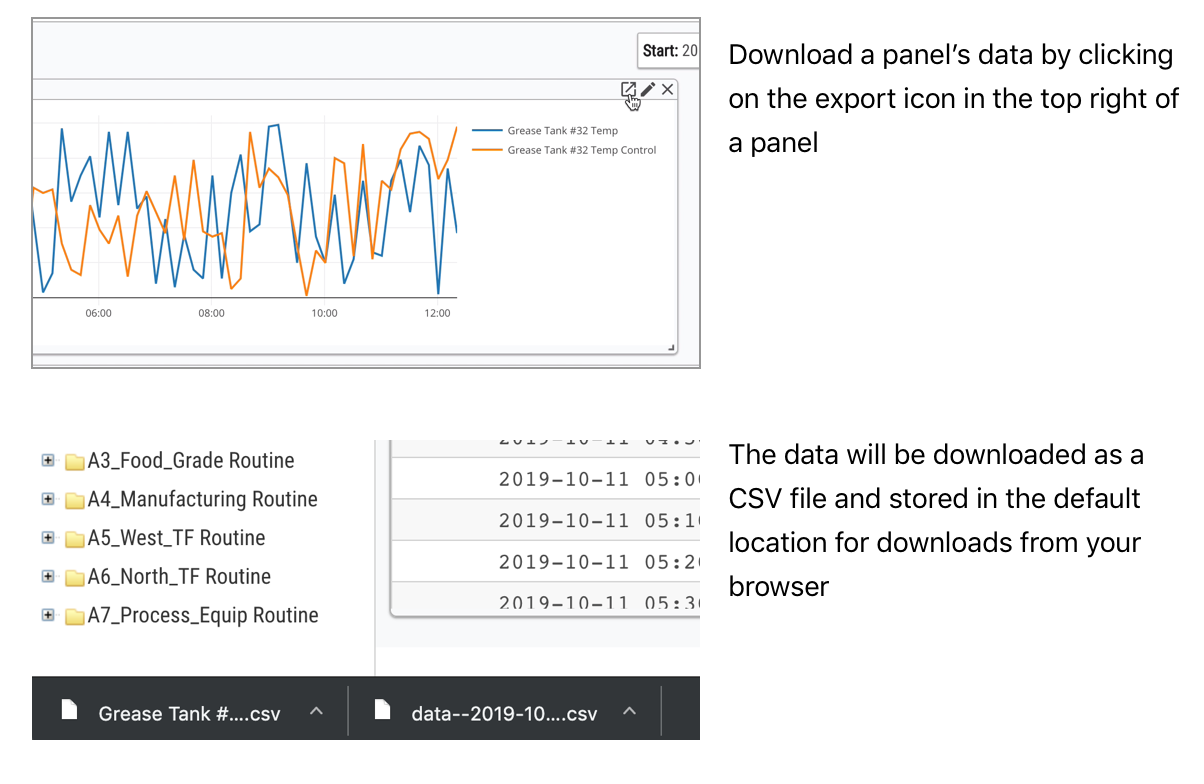
Figure 13: Export all data attached to a Panel to a CSV file
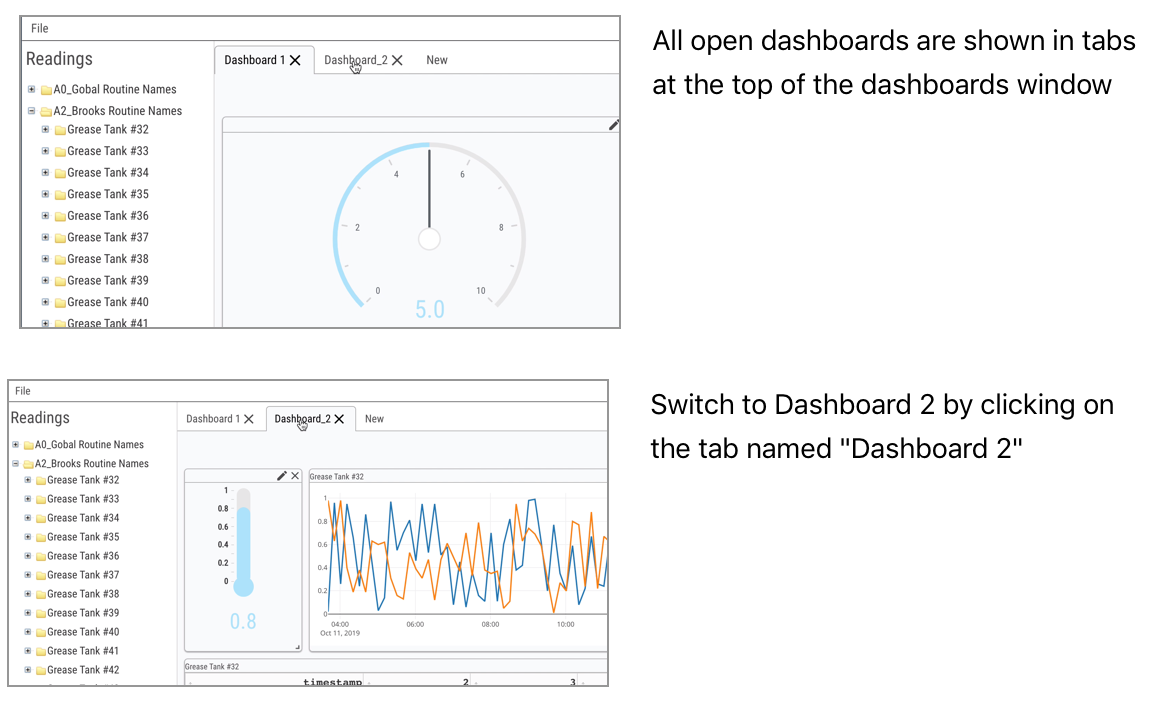
Dashboards
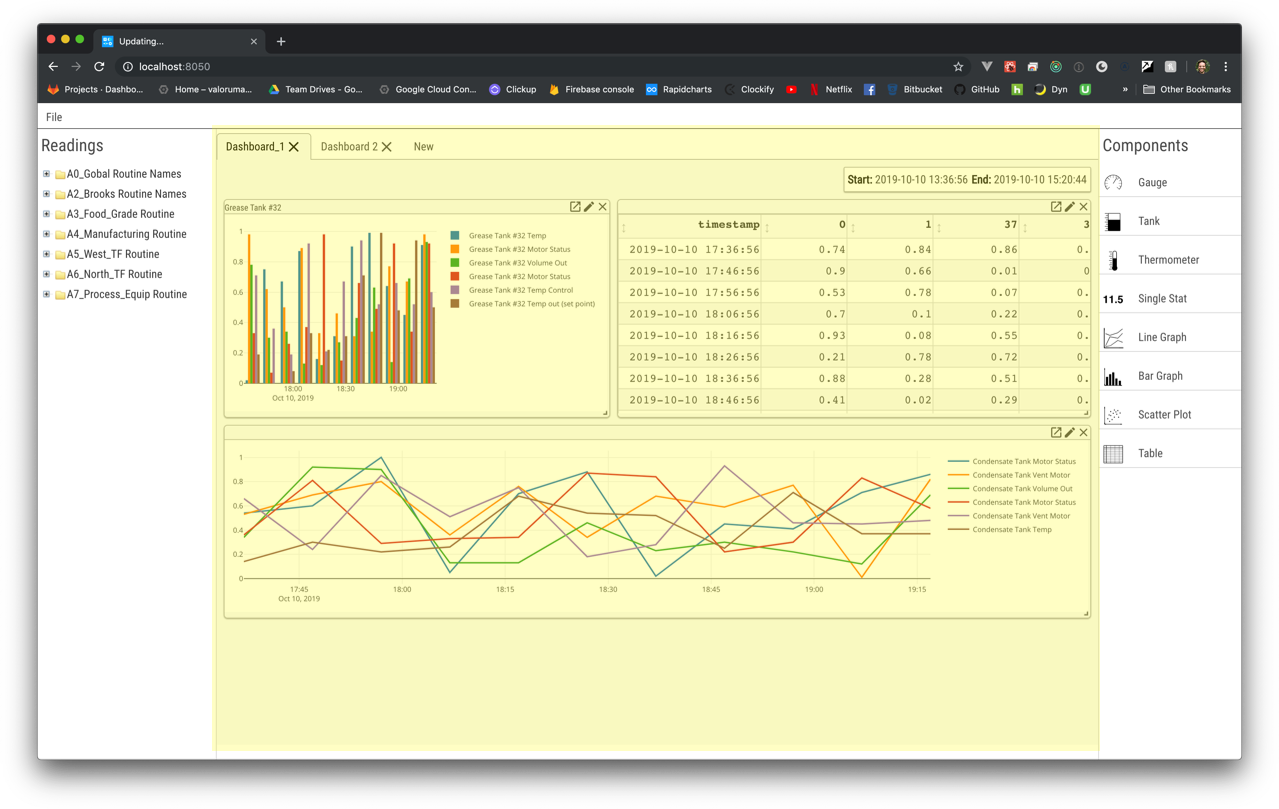
Figure 14: Dashboard section of PlantExplorer interface
A Dashboard is a collection of Panels and their configuration
Dashboards can be saved, opened, and deleted like files from other programs
Save a Dashboard
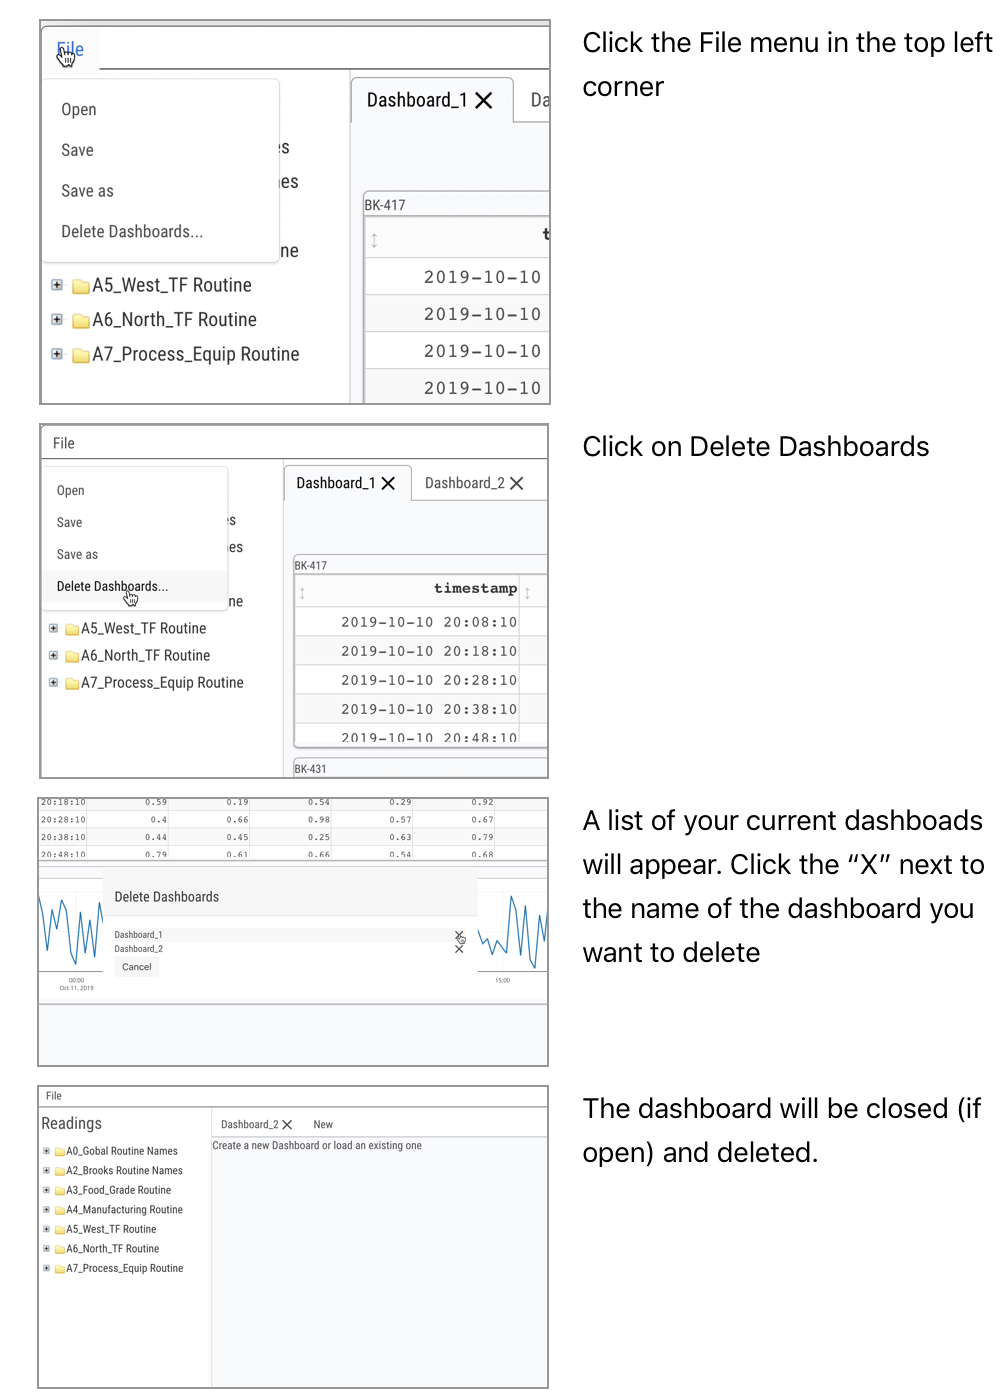
File-level operations (save, open, delete) on a Dashboard are accessible via the File menu in the top left of the interface (just above the Readings list)
When File is clicked, a menu will open that allows you to open, save, save as (save with a supplied name), and delete Dashboards
Clicking Save As will open a modal sub-window where you can enter the Dashboard’s name to save the Dashboard
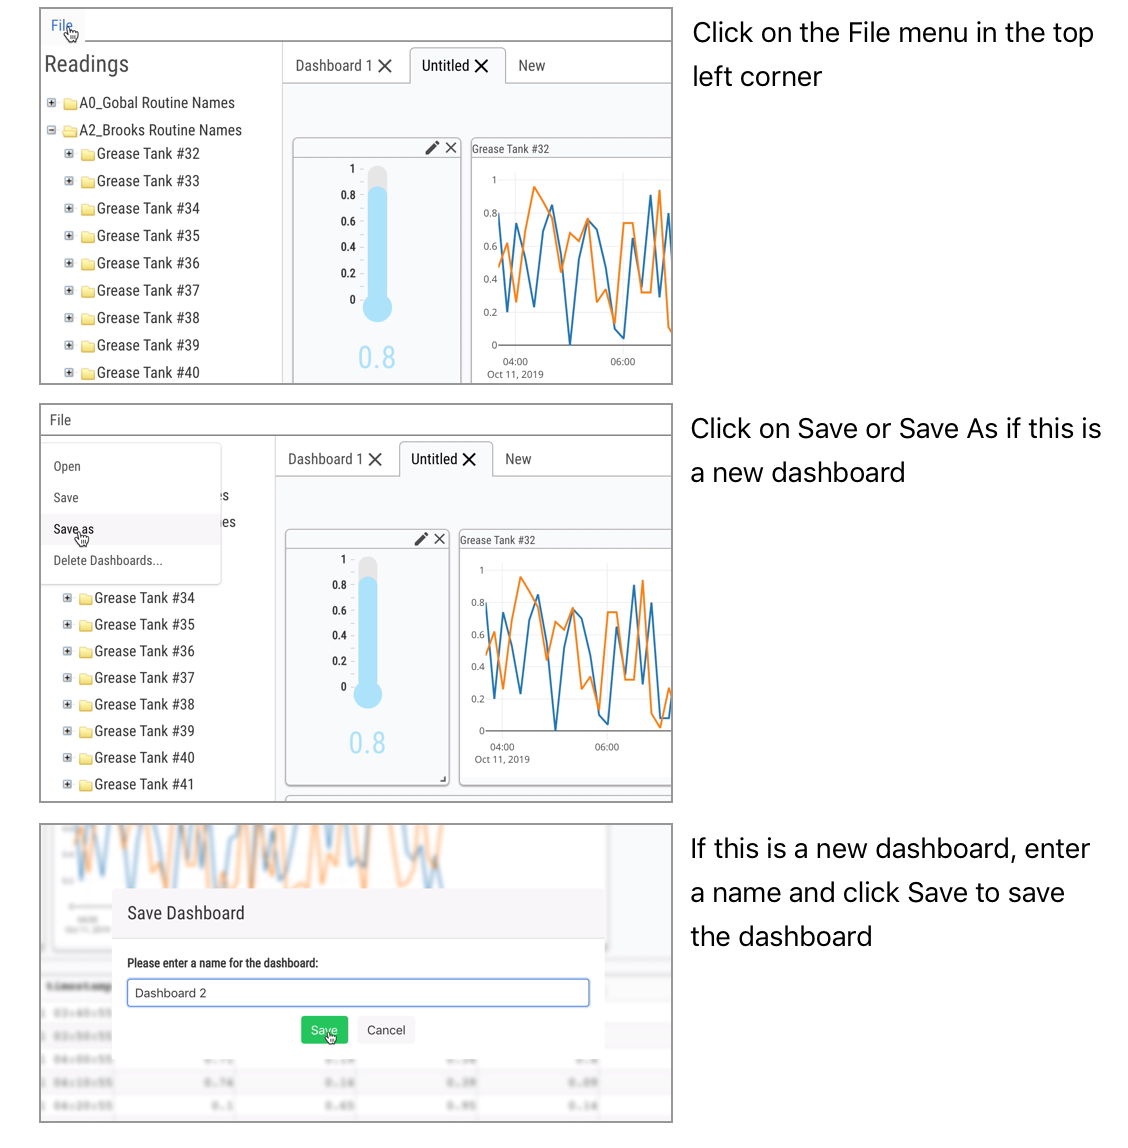
Figure 15: Saving a PlantExplorer Dashboard via the File menu
Open a Dashboard
Clicking Open from the File menu will open a modal sub-window with a list of previously saved Dashboards, using the name previously supplied to identify each Dashboard
Clicking any of these names will open the associated Dashboard in a new tab
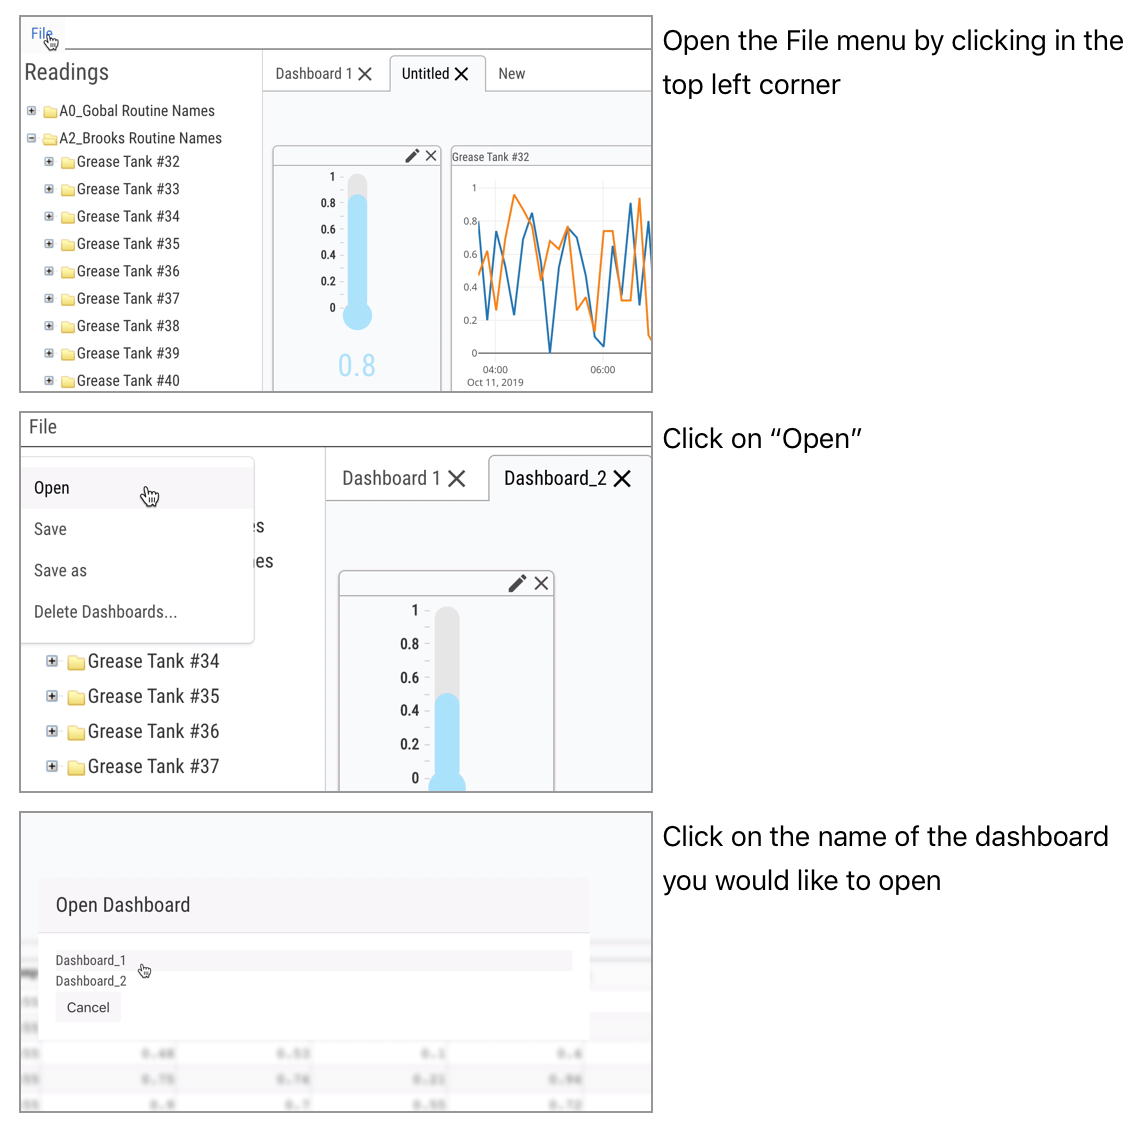
Figure 16: Opening a PlantExplorer Dashboard via the File menu
The Time Window
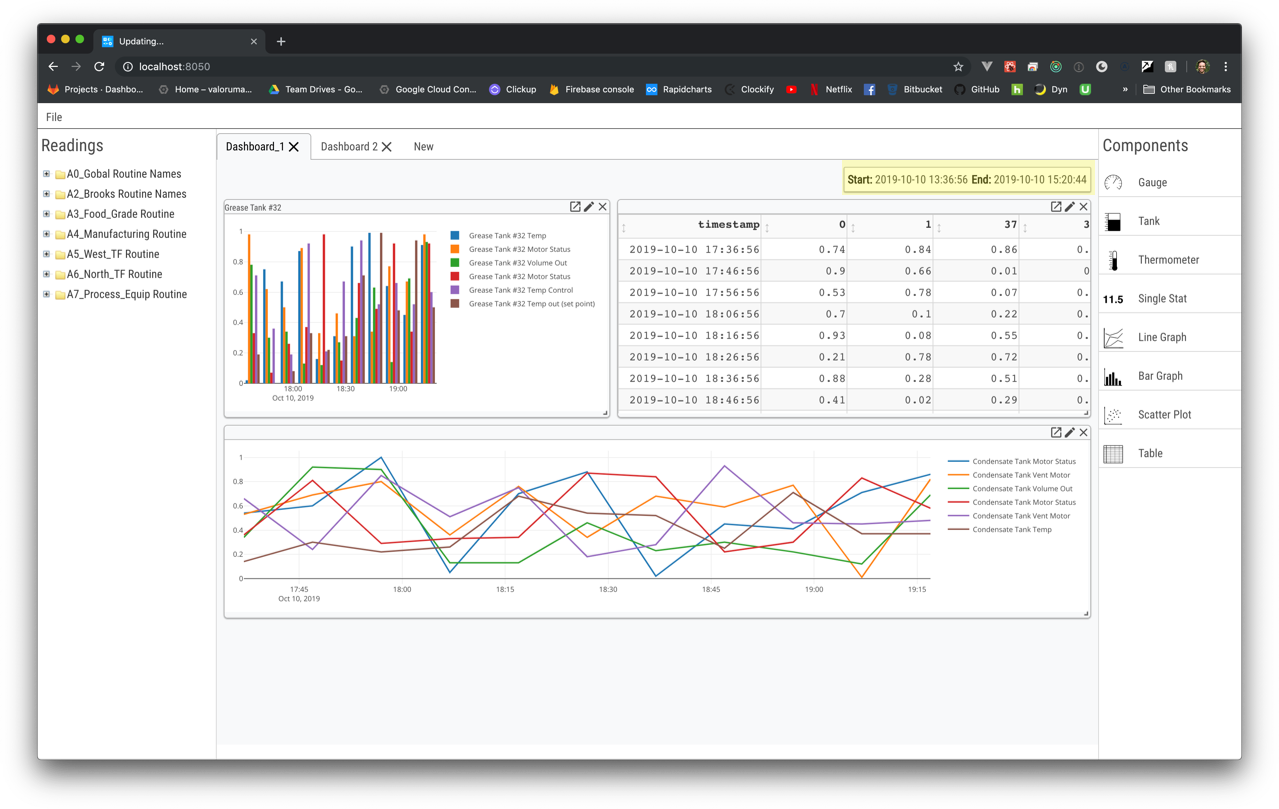
Figure 19: The Time Window section of the PlantExplorer interface
The last main component of the PlantExplorer interface is the Time Window
The Time Window is located at the top right of the Dashboard and includes a Start and End time
The current value of Start and End in the Time Window determines the time range for which data is displayed in all Panels in the Dashboard
Changing the Time Window
In order to change the Time Window, click anywhere on its display
Upon clicking, a modal sub-window is opened that exposes controls the Time Window
There are two ways to change the Time Window:
Click one of the quick ranges
Enter a Click the calendar icon next to the
StartorEndlabels and pick a precise date and time
When you are finished updating the Time Window, click the Apply button
You will be returned to the main Dashboard view and all Panels in the Dashboard will be updated to show data for the selected Time Window
If you click Cancel instead, you will also be brought back to the main Dashboard view but no Panels will change
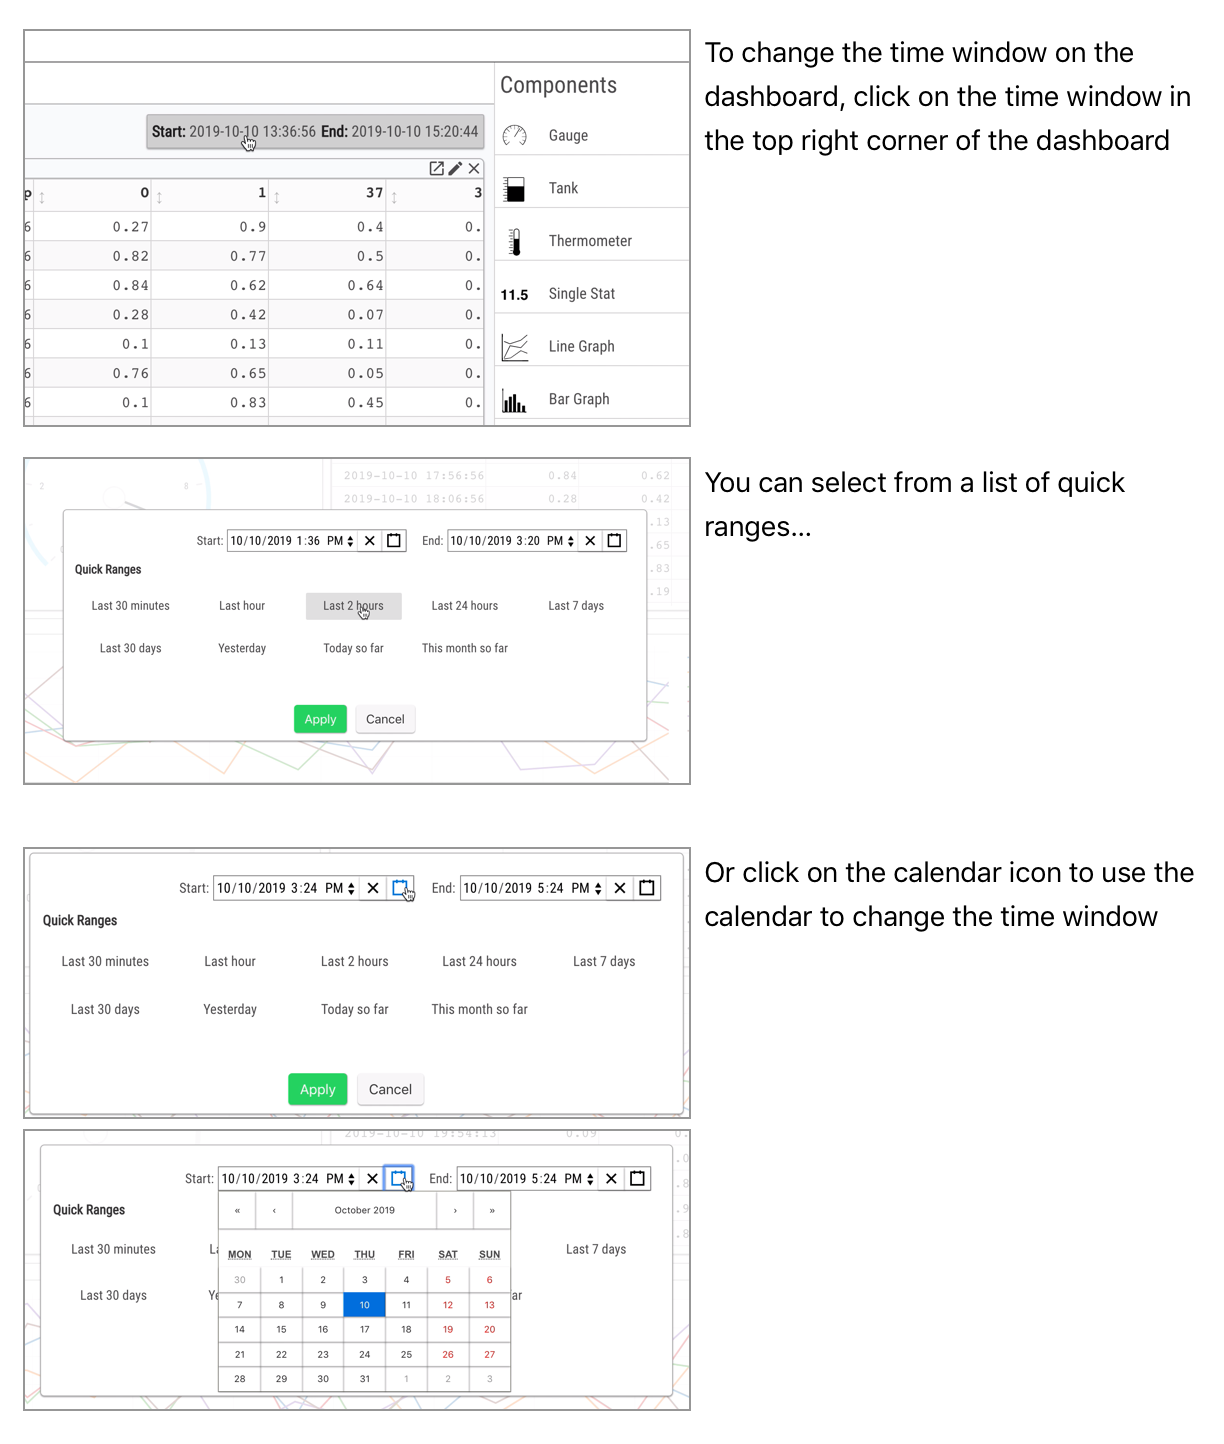
Figure 20: Change the Time Window for a PlantExplorer Dashboard. After changing the Time Window, all Panels in the Dashboard are updated
Changing the Time Window via a Chart
In addition to updating the Time Window directly by clicking on it, you can also update the Time Window by zooming on any chart
To do this, click-and-drag horizontally on any chart Panel
When the mouse is released, the Time Window will be updated to match the start and end point of the mouse drag operations
As with setting the Time Window directly, setting it via a chart zoom operation will cause all Panels to update to the selected time window
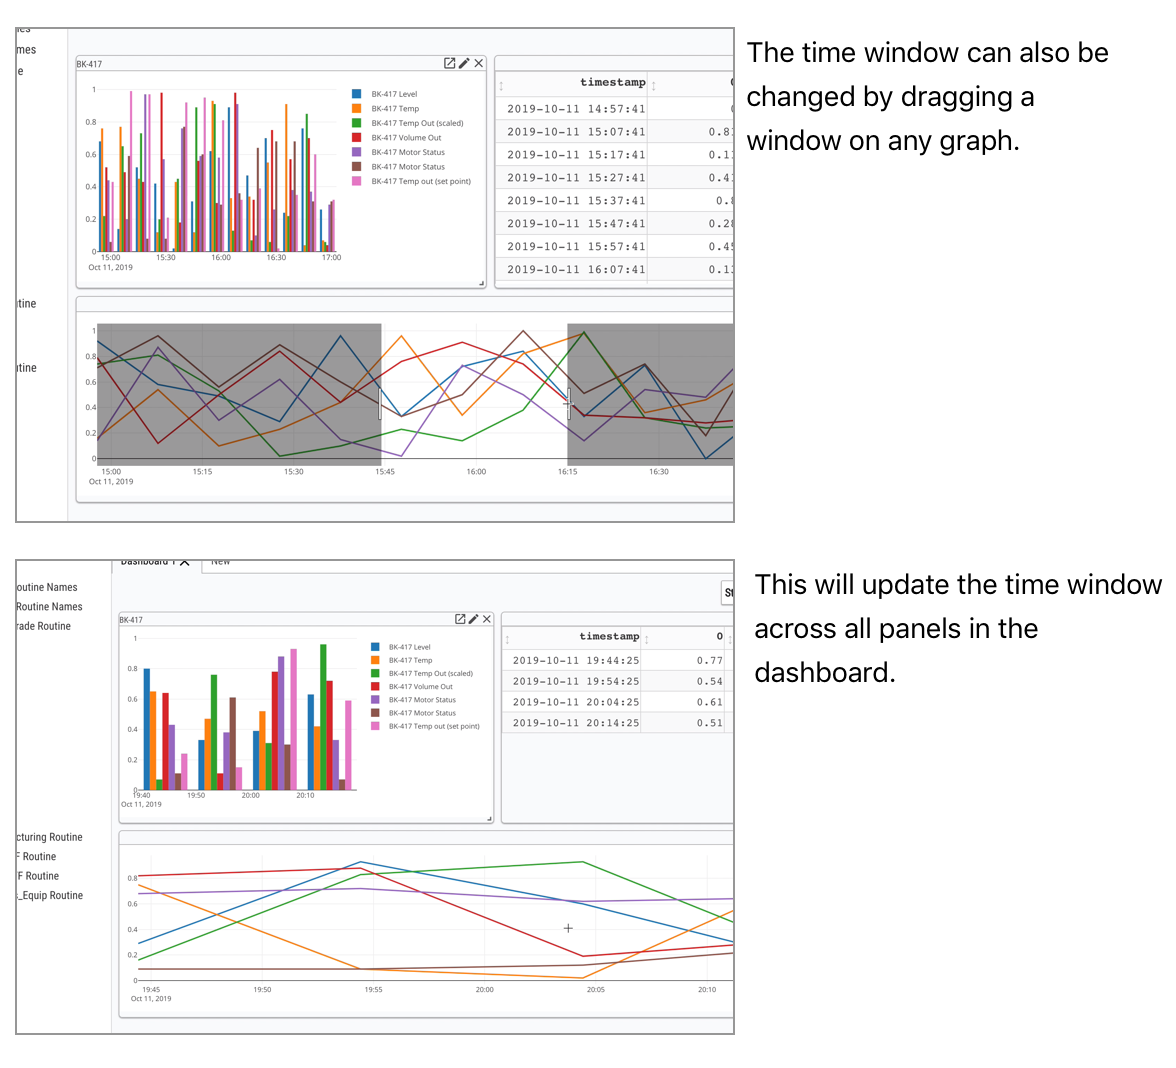
Figure 21: Change the Time Window for a PlantExplorer Dashboard by zooming to a specific time range on a Chart. After the zoom, the Time Window changes and all Panels in the Dashboard are updated